之前我们知道,我们可以使用lldb调试手机上的App,而Xcode就是用的lldb进行调试的,而且功能非常强大,例如查看UI层级结构,查看调用栈,打断点,lldb只能提示等等,使用起来比直接用lldb调试会方便很多,这里记录一下如何在XCode调试第三方App
直接启动调试
我们先拿到
脱壳的第三方App(WeChat),进行重签名,得到WeChat.app有很多种脱壳的方式,笔者用的是
iOS13,用的是CrackerXI+工具新建一个新的工程,证书与重签名的一致,修改bundleId为
com.tencent.xin,运行到手机上把
WeChat.app放到工程根目录,在工程添加Run Script1
2# 运行之前换成第三方app,达到偷梁换柱的目的
cp -rf "${SRCROOT}/WeChat.app" "${BUILT_PRODUCTS_DIR}/"接下来就跟我们平常调试应用一样,只是没有源码可以看
添加断点
通过Hopper查看方法的地址为: 0x0000000102a9602c
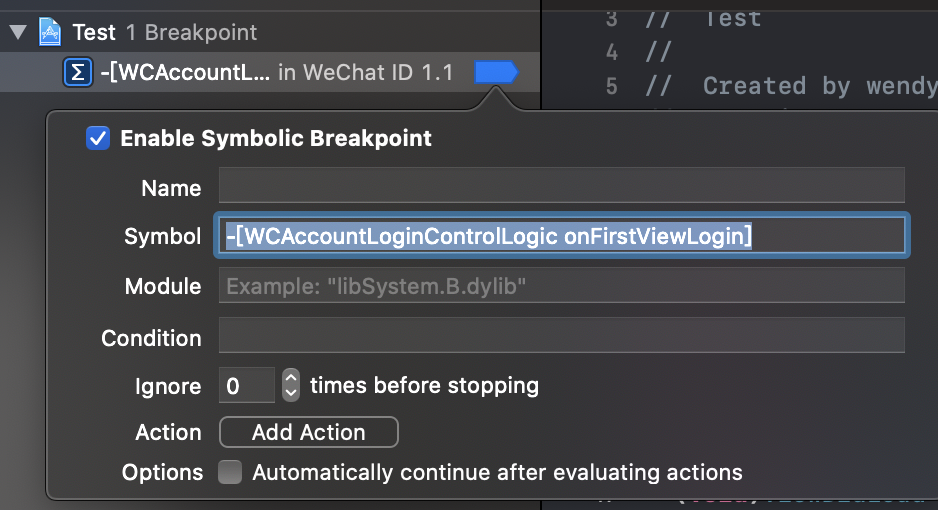
1 | -[WCAccountLoginControlLogic onFirstViewLogin]: |
打断点
1 | # 1. 查看ASLR为:0x0000000000558000 = 0x0000000100558000 - 0x0000000100000000 |
断点只能通过地址添加,并不能解析符号,另外Xcode也不能解析堆栈信息,我们可以用restore-symbol恢复符号表
恢复符号表
为了方便调试,打断点,查看堆栈调用信息,我们可以使用restore-symbol恢复符号表
使用方法,网站上很详细了
1 | # 下载 |
恢复block的符号表需要借助IDA导出映射关系,具体见网站说明,恢复符号表后需要重签名
打符号断点
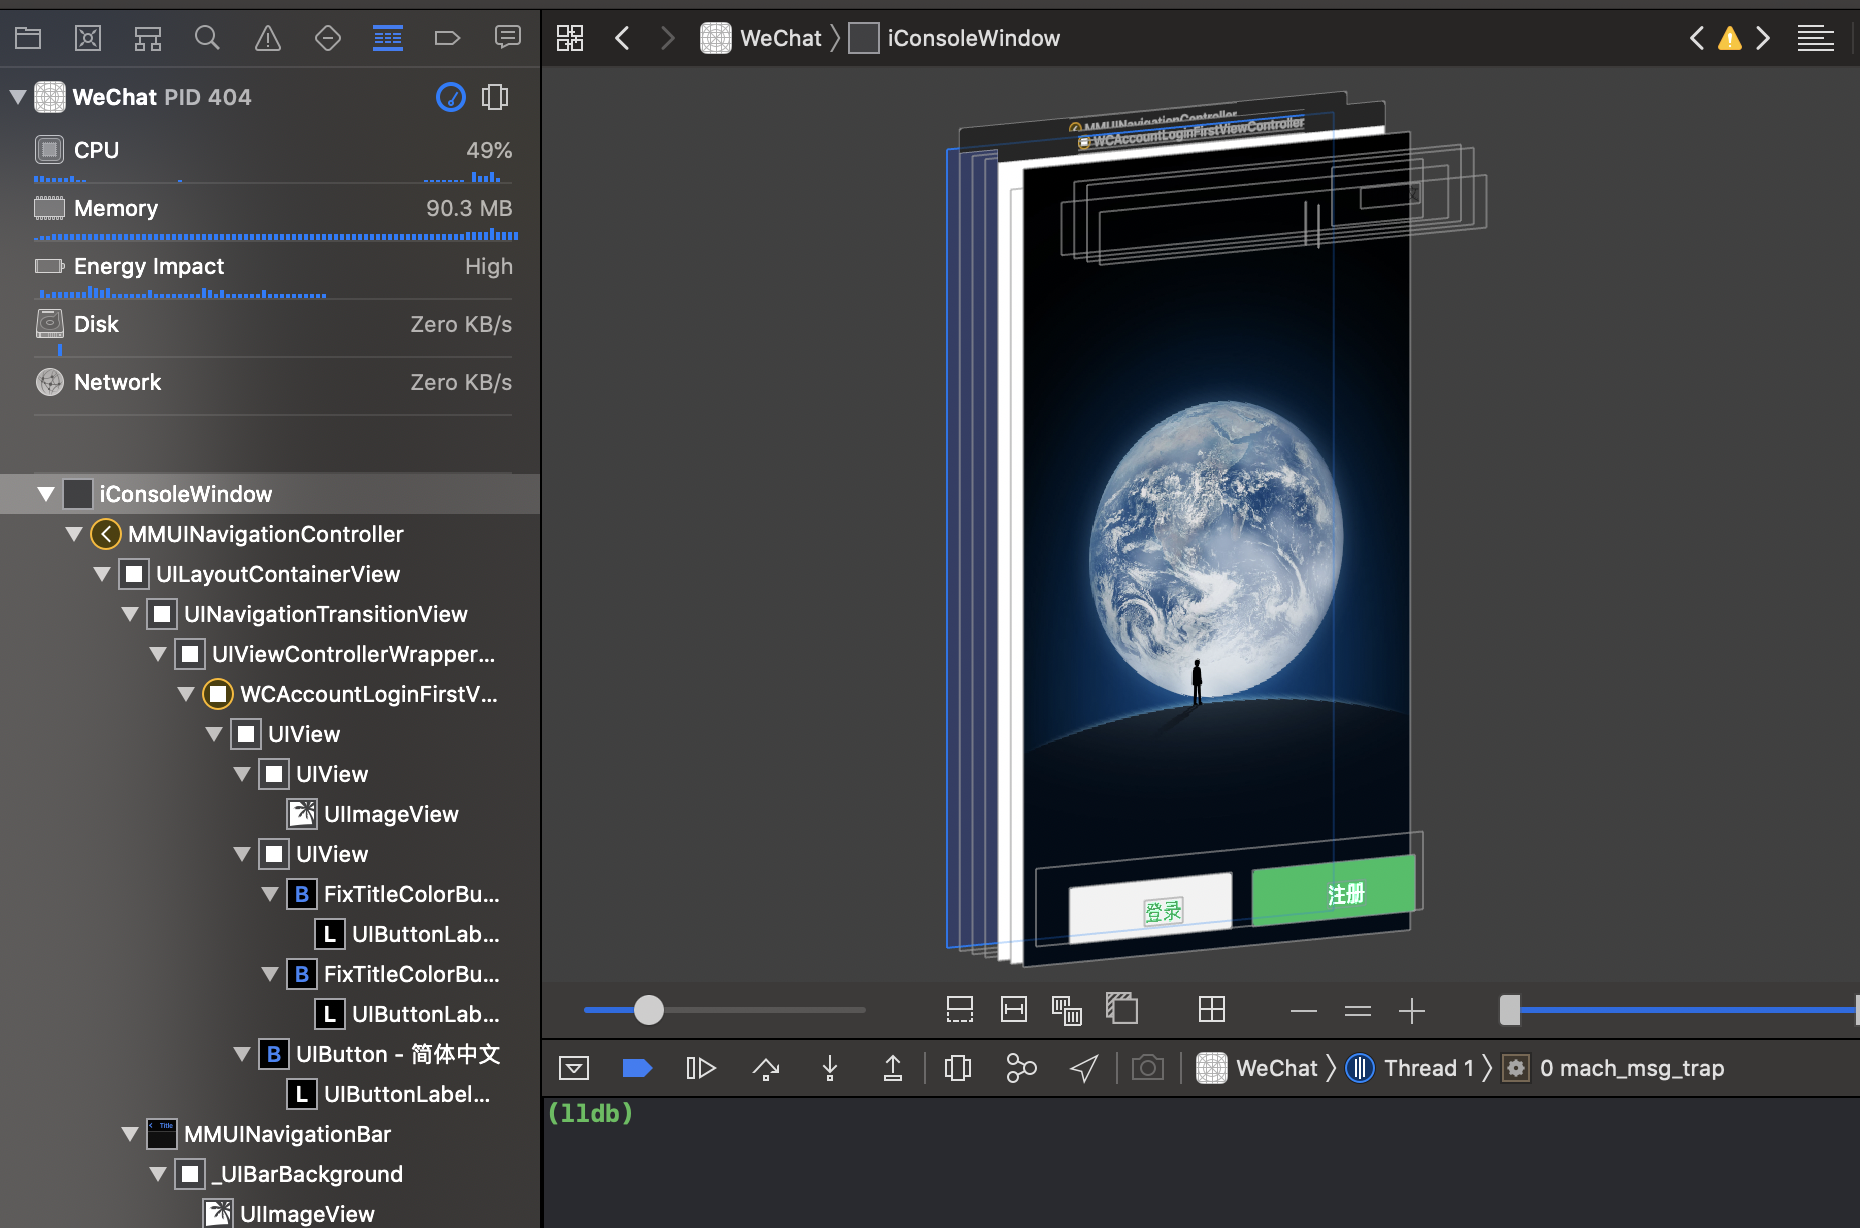
UI 层级
远程附加调试
先安装第三方App(脱壳),然后新建一个新工程,运行
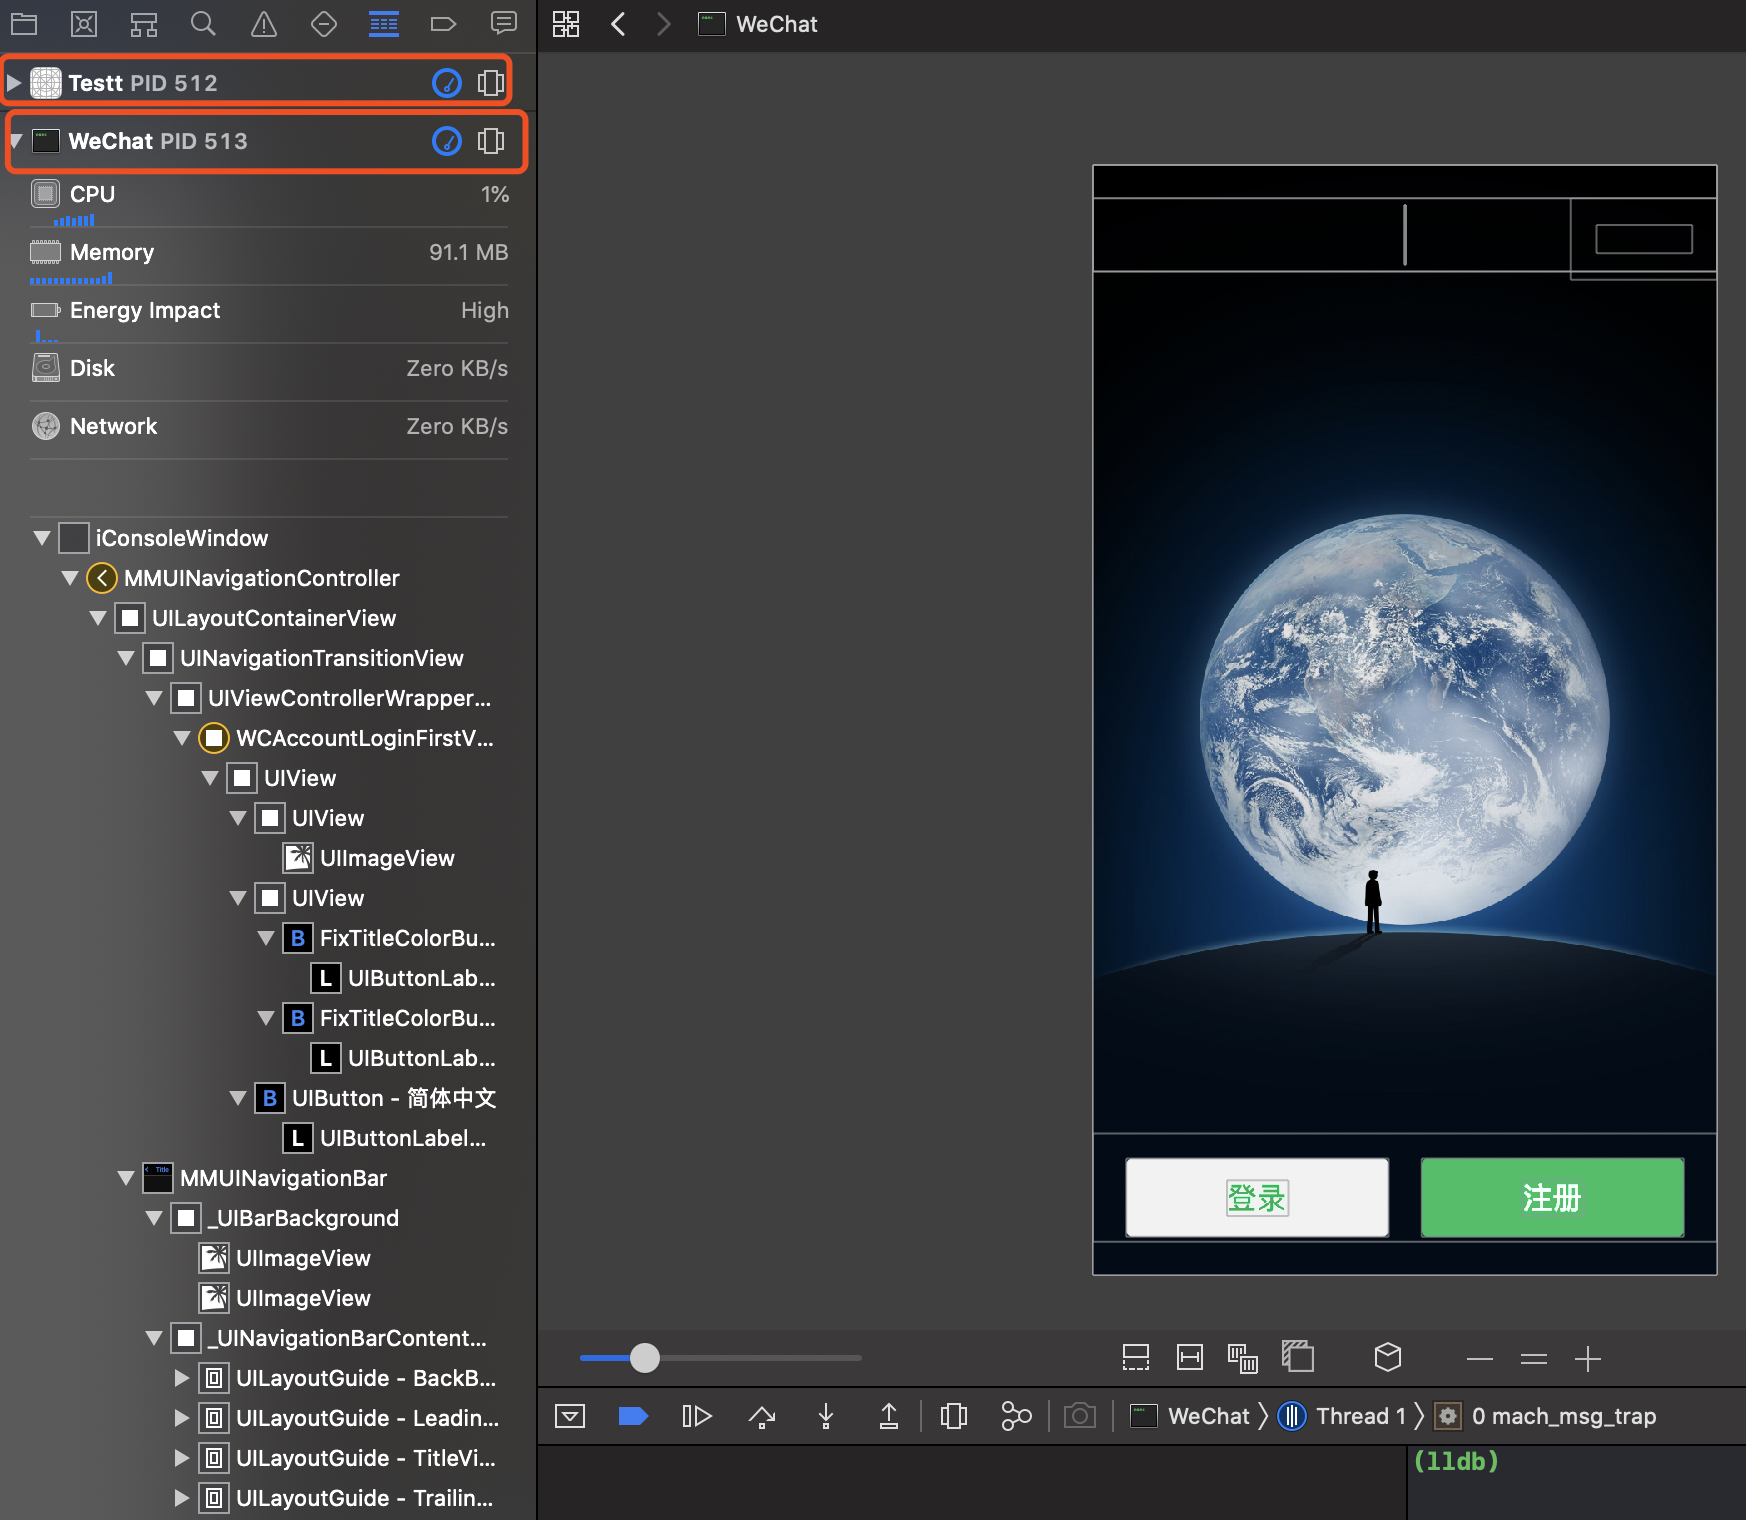
在XCode -> DEBGU -> Attach to Process,然后选择对应的进程附加
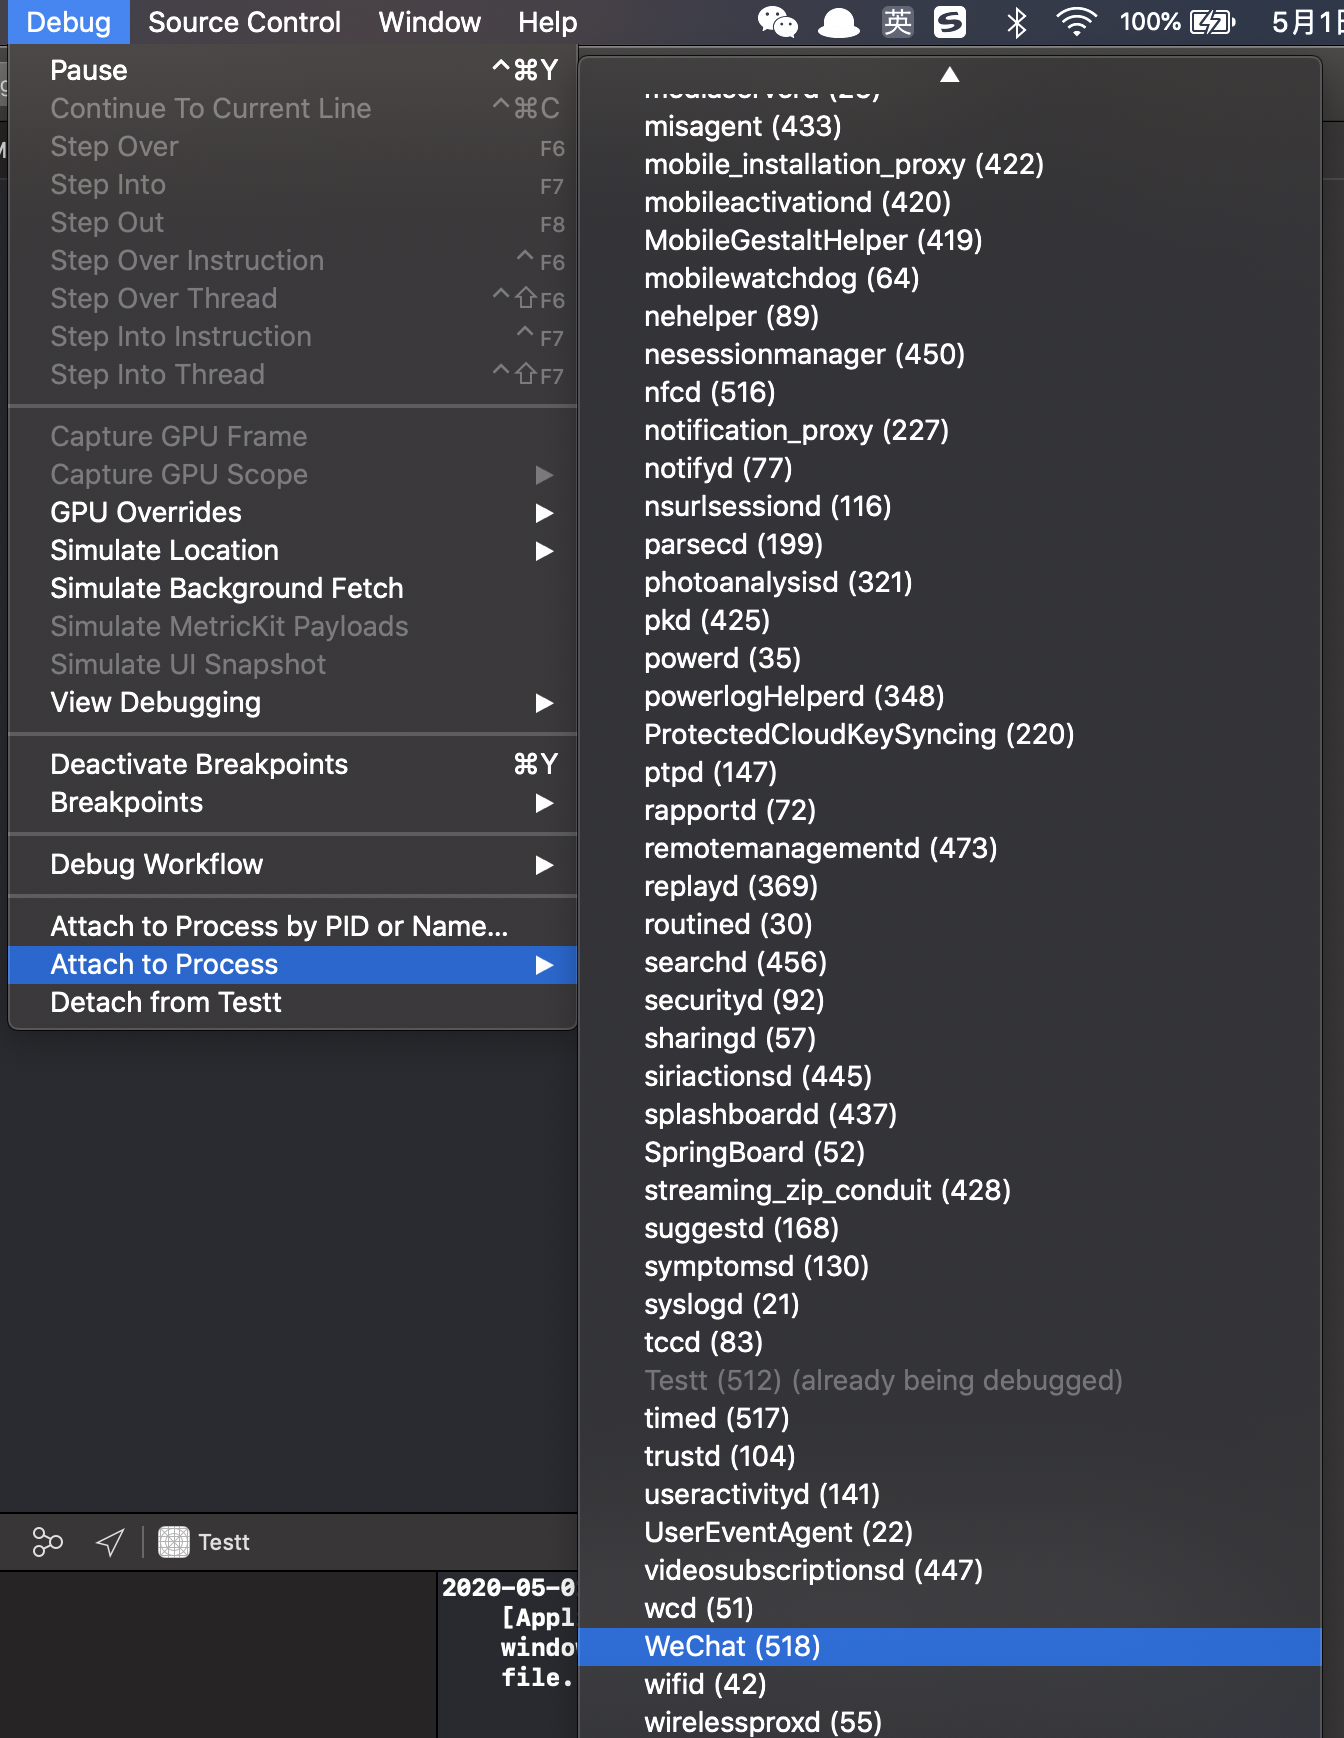
用起来和直接调试是一样
附加调试有时候会很慢